The idea to write the article were inspired me by our very first KIT club conference. In the conference I’d talked about advanced SQL server monitoring techniques and after a lot of great feedback I decided to write what I talked about in more detailed way and to share a source code. If you will find any issues to use the source, you know where to find me.
In this article I’ll go through the very important places for advanced SQL server monitoring. This will not cover all SQL server monitoring, but will show you some methods I have not found that any monitoring software are already using. I will cover storage, performance counters, backups, indexes, waits and SQL server configuration changes monitoring. So, lets start from storage monitoring first.
Storage monitoring
The most popular way to monitor SQL server storage is to get an alert email with drives free space thresholds. This might be configured to receive daily emails with current details on drives, or to send an alert when a disk free space getting to low. It’s not perfect and it’s not enough to be one step ahead. Let me give you same examples. One day I’ve received an email with details:
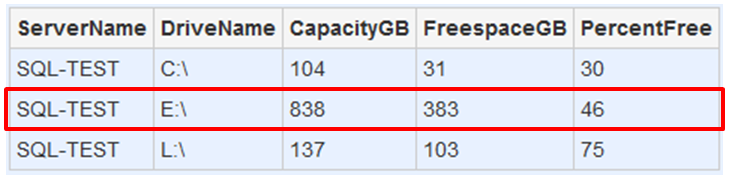
The thresholds on the email looks perfect, I don’t need to take any actions, everything looks fine. But the other day I’ve received another email with different details:

In the alert email I found that the E: drive is almost full. Now, I’m in trouble. My server is in trouble. I need to take an action immediately. But wait, how to avoid situation like this? It would be better to know, when it might happen and to take an action before production database goes unresponsive. For this I have created SSRS report to monitor storage and I’m able to plan capacity:
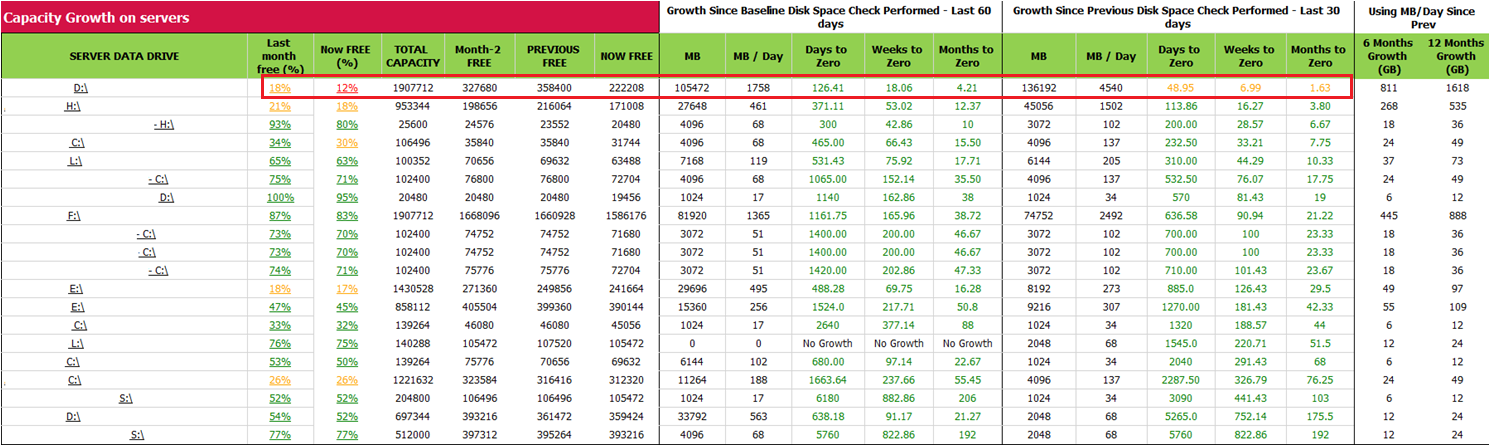
As you can see from the report, in the first section on the left side we have details for each server drive: last and current months free space in percent, total capacity, how many free space in megabytes have been before two months and last month, and how many free space there are now. In the next two sections we can find disk space growth since baseline disk space check performed last 60 and 30 days. In the next two sections “Grow since baseline disk space check performed – Last 60 days” and last 30 days are information about how many megabytes disk grew up in total (column MB) and per day (column MB/Day) since baseline. But the most important is to know how many days/weeks/months (columns Days/Weeks/Months to zero) we have to zero. Having this information, we are able to plan future steps and avoid disk space issues on a server. The last two columns predict how many GB’s a disk will growth in the next 6 and 12 months with the current growth. Even more, we are able to drill down by clicking on any server drive to check disk growth in last three or more months in more details:
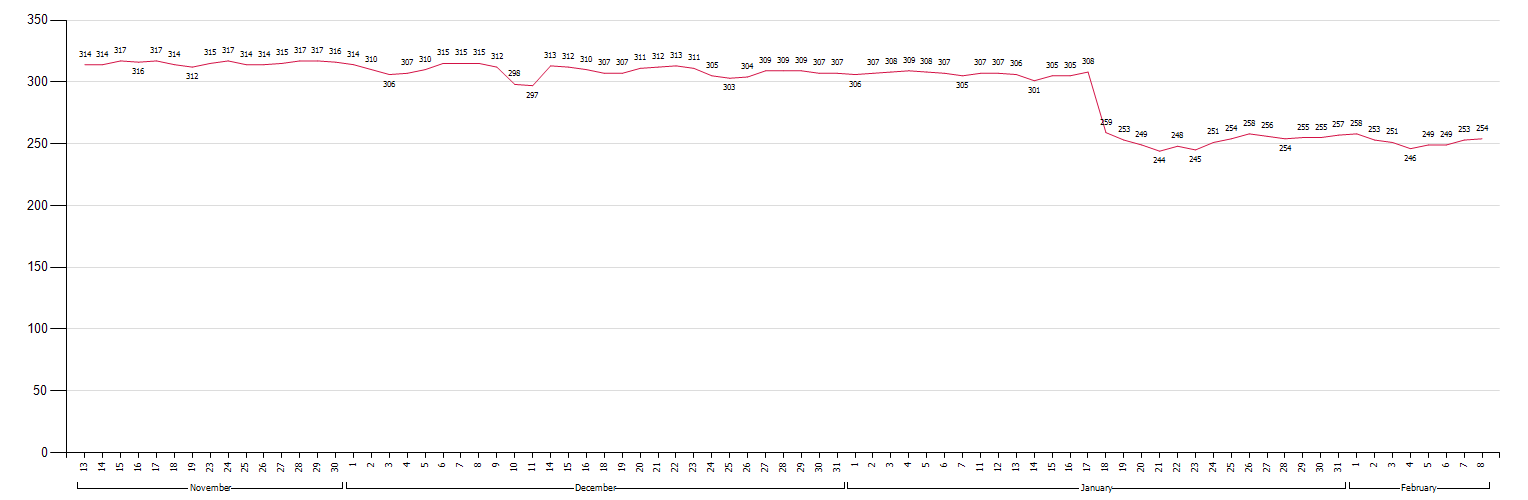
By having those very simple SSRS reports we are able to do huge work and more important – avoid troubles and mistakes.
Performance counters
Unlike storage monitoring, there are number of different methods to monitor SQL server performance counters. But I didn’t saw the tool to clearly compare and to have a very simple view of your server. It’s very popular to draw a curve for each counter but on the other hand, it’s not so easy to read the values.
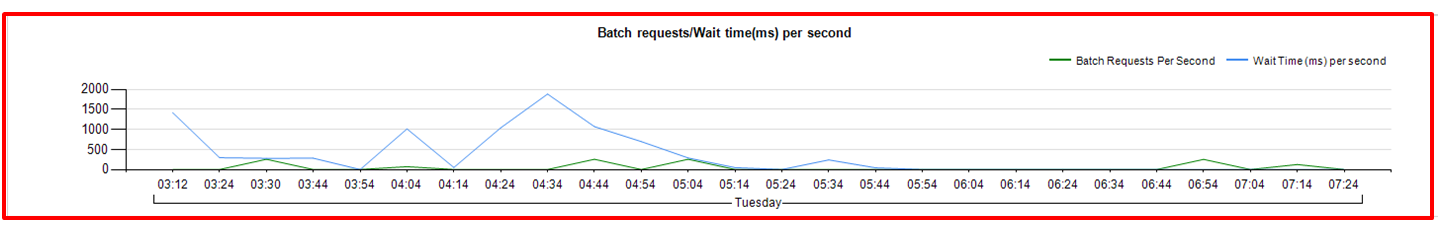
The most important things we should know about SQL server are – how heavy a SQL server is, how fast a SQL server is running and how hard a SQL server is running. It’s very easy to answer how heavy a SQL server is – everything you need to know is how many megs or gigs your databases are in total. This very important when you need to think about – maintenance (indexes, statistics); backups configuration; etc. How fast a SQL server is running we will find from the batch request per second performance counter and how hard a SQL server is running – from wait time per second. The funny thing is that a SQL server can wait for 3 seconds in 1 second. This is because at the same time SQL server can wait for number of different things – storage, CPU, IO, network etc. I have created a SSRS report to monitor performance counters in very easy way, so we can see when a SQL server running very fast:

Or, when a SQL server running very hard:
Backup monitoring
When we are using 3rd party tools to backup databases, the tools usually providing a report about successfully and unsuccessfully backups. That’s sounds cool and looks like we are done here. Unfortunately not. I had some situations when backup tool were green and no alerts, but in true the backups was not performed. For this I have found a way to check and to be alerted if I have a database without Full/Diff or Log (for databases in full recovery mode) backups:

If I receive the email like above, I know, that I should go and check if backup process were failed or maybe I have missed to schedule a log backup for database in full recovery mode. This ensures at least that I will not dismiss to configure backup for any database (new or after recovery mode change, etc) and informs if something went wrong.
Index monitoring
We should not only care about index maintenance, but to monitor missing and unused indexes too. Every index must be reviewed if it’s not missed or is unused. This does not mean that we should create every single missed index or drop every unused one. This need a lot of hard work and knowledge about your database.
I prefer at least on monthly basis to get a report about index usage:
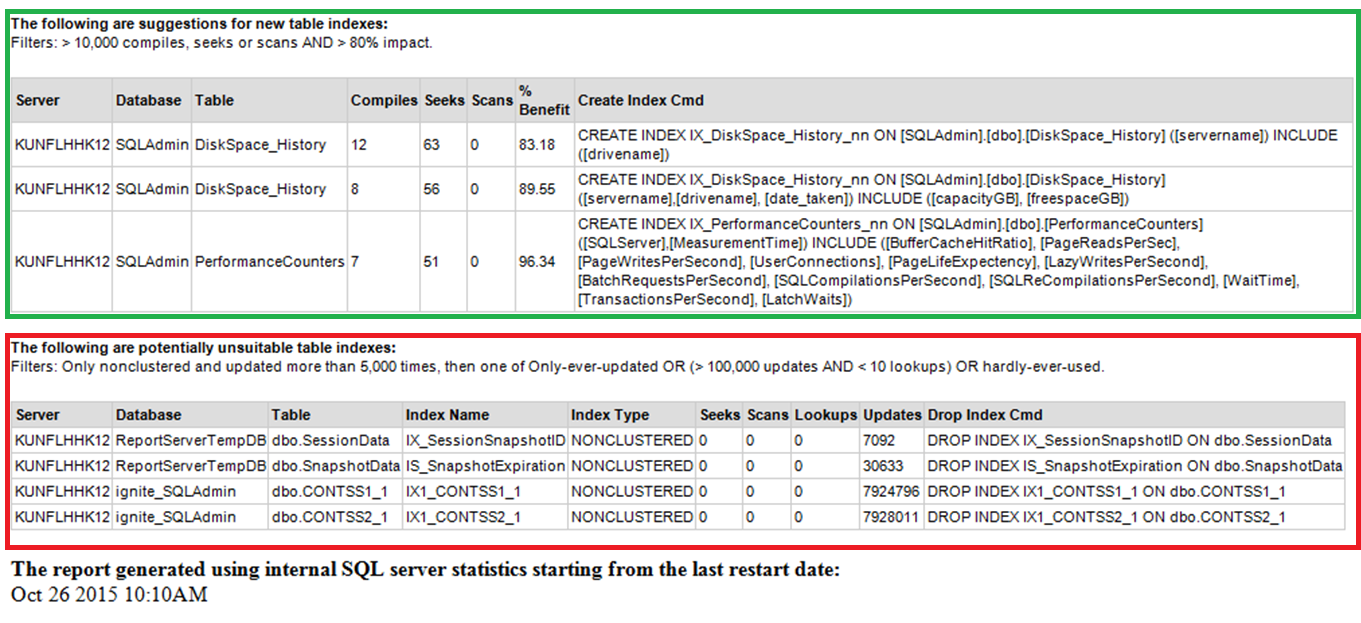
In the green square we are able to find filtered (more than 10k compiles/seeks/scans and more than 80% impact) missing indexes. In the red square – unused indexes. By having this report it’s very easy to start looking on an index needs.
Waits monitoring
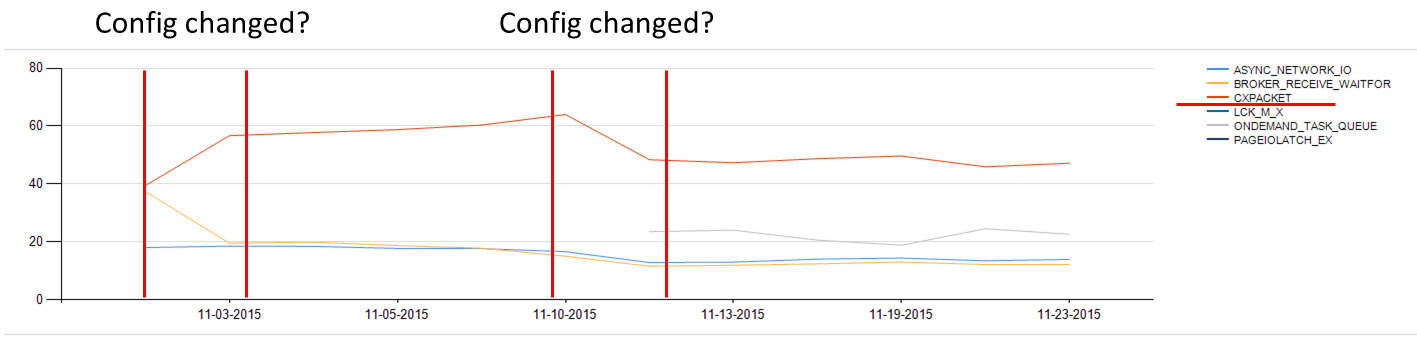
To have a good picture of a SQL server bottlenecks, config changes, etc., the wait statistics report is what we need. It’s simple, powerful way to identify why SQL server running slower than previously, to know if after the config changes SQL running faster or maybe slower, to forecast changes needs to SQL server. Let me show you how easy to check things:

From the report we can very easy identify, that some CPU related changes (probably max degree of parallelism or cost threshold for parallelism) has been made two times:
SQL server configuration changes
It is extremely important to know if any key SQL server configuration change has been made or a trace flag were turned on by someone especially without meeting change control process:
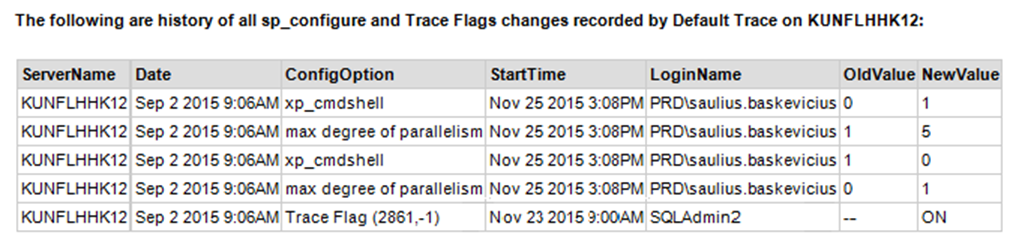
From the alert we may identify who and when made a change, what the old value been and what the new value are.
That’s all I got for this time. Hope you will find useful points to improve your monitoring solution! As I mentioned at the beginning, if you have any question, please ask me. I’ll do my best to help you.
All the source code you can download here.